Kubernetes Cost-Cutting That Actually Works: Rightsizing at Scale

“Wait… why is our cluster at 8 % CPU and we’re still paying a fortune?”
If you have stared at a cloud bill that grows faster than your traffic, you already know the answer: most workloads in Kubernetes are wildly over-requested.
Datadog’s 2020 container report put a number on it—almost half of all containers use <30 % of the CPU and RAM they asked for. Google Cloud’s own research reaches the same conclusion: rightsizing is the single biggest lever for cost reduction in Kubernetes.
In this post I’ll show you the pipeline I built to attack the problem across many clusters (TLDR):
- We collect 365 days of Prometheus metrics and feed them into KRR (Robusta Kubernetes-rightsizer).
- A tiny Python wrapper runs KRR against every kube-context I own.
- The output is manually written into Git (future improvement at sight!), where an ArgoCD app automatically updates the resource requests and limits in the clusters. (I wish we were already in Kubernetes 1.33 where workloads don't need to be restarted, but well...)
- A Grafana dashboard lets engineers in my team explore waste in real time, drill down per node pool, namespace or deployment, and verify the savings after each rollout.
The result? In the last six months I freed ~500 vCPU cores and ~200 GiB of RAM without a single incident—and I finally have numbers I can really use for capacity planning.
Meet KRR, the “Vertical Pod Autoscaler without the magic”
KRR is a CLI that ingests historical Prometheus metrics and suggests sensible values that later you can apply to your workloads. No controllers, no CRDs, no VPA, no side effects—just a report.
A simple invocation looks like this:
krr simple \
  --mem-min 25Mi          # never go below 25 MiB
  --cpu-min 1m            # never go below 1 millicore
  --cpu-percentile 95     # base CPU on p95 usage
  --timeframe-duration 1  # inspect 1-month windows
  --history_duration 365  # keep 12 months worth of data
  -n my-namespace         # focus on a single namespace
  -r Deployment           # or StatefulSet, handy to restrict
  --use_oomkill_data      # bump RAM if I saw OOMs
  --show-cluster-name     # in case you plan to aggregate contexts
  --context my-context    # context(s) to use
  --fileoutput-dynamic     # generate one file per workload
That works great—until you have more than one cluster. I have dozens to oversee, so the real game-changer is the tiny wrapper below.
Scaling KRR: a Python helper
import subprocess

# Your list of contexts (clusters)
CONTEXTS = [
    "context-1",
    "context-2",
    "context-3",
    ...
]

# Specific Prometheus endpoints, as sometimes it fails to properly get them
# No need to specify every single one, as it will try to auto-discover it
PROMETHEUS_ENDPOINTS = {
    "context-1": "https://user:[email protected]",
    "context-3": "https://user:[email protected]",
    ...
}

# The default namespace to check if not providing args
NAMESPACE = "namespace-to-check"

KRR_COMMAND_ARGS = [
    "krr", "simple",
    "--mem-min", "25",
    "--cpu-min", "1",
    "--cpu-percentile", "95",
    "--timeframe-duration", "1",
    "--history_duration", "365",
    "--use_oomkill_data",
    "--show-cluster-name"
    "--fileoutput-dynamic"
]

def run_krr(context, namespace, prometheus_endpoint=None):
    command = KRR_COMMAND_ARGS.copy()
    command += ["--context", context, "-n", namespace]

    if prometheus_endpoint:
        command += ["-p", prometheus_endpoint]

    print(f"\n🚀 Running krr on context '{context}' namespace '{namespace}'")
    print(f"🔗 Prometheus endpoint: {prometheus_endpoint or 'Auto-discovered'}")
    print(f"🔧 Command: {' '.join(command)}")

    try:
        subprocess.run(command, check=True)
        print(f"✅ Success: {context}")
        return True
    except subprocess.CalledProcessError as e:
        print(f"⚠️  Error running krr on context '{context}': {e}")
        return False

def main():
    success_contexts, failed_contexts = [], []

    for context in CONTEXTS:
        prometheus_endpoint = PROMETHEUS_ENDPOINTS.get(context)
        result = run_krr(context, NAMESPACE, prometheus_endpoint)

        if result:
            success_contexts.append(context)
        else:
            failed_contexts.append(context)

    # Summarize at the end
    print("\n📊 Execution Summary:")
    print("========================================")

    print(f"\n✅ Successful clusters ({len(success_contexts)}):")
    for ctx in success_contexts:
        print(f"  - {ctx}")

    print(f"\n⚠️ Failed clusters ({len(failed_contexts)}):")
    for ctx in failed_contexts:
        print(f"  - {ctx}")

    print("\n🏁 Done. Please check outputs above for errors.")

if __name__ == "__main__":
    main()
The script finishes in less than an hour (quite a drop from the multi-day run I used to suffer when only doing it manually with the CLI command), drops one folder per namespace krr-<cluster>.txt and hands the baton to me, and then our GitOps layer.
Obviously, we shouldn't blindly update to those values, as it would be quite risky. Our team lead blindly updated Velero with my still-in-alpha scripts without much afterthought, reducing RAM that was critically needed only once daily, therefore provoking a multi-cluster backup chaos. At least we all learnt the lesson.
Also, if we blindly updated to the suggested values, a VPA could actually be a replacement if the human reasoning. But as we're still in the "pets" season, I will leave the "cattle" when we get past the 100+ clusters (or earlier, but nevertheless, it's in my roadmap).
So, how to validate that the KRR suggestions are actually reasonable? Let me present you the next big piece of software: My Grafana dashboard.
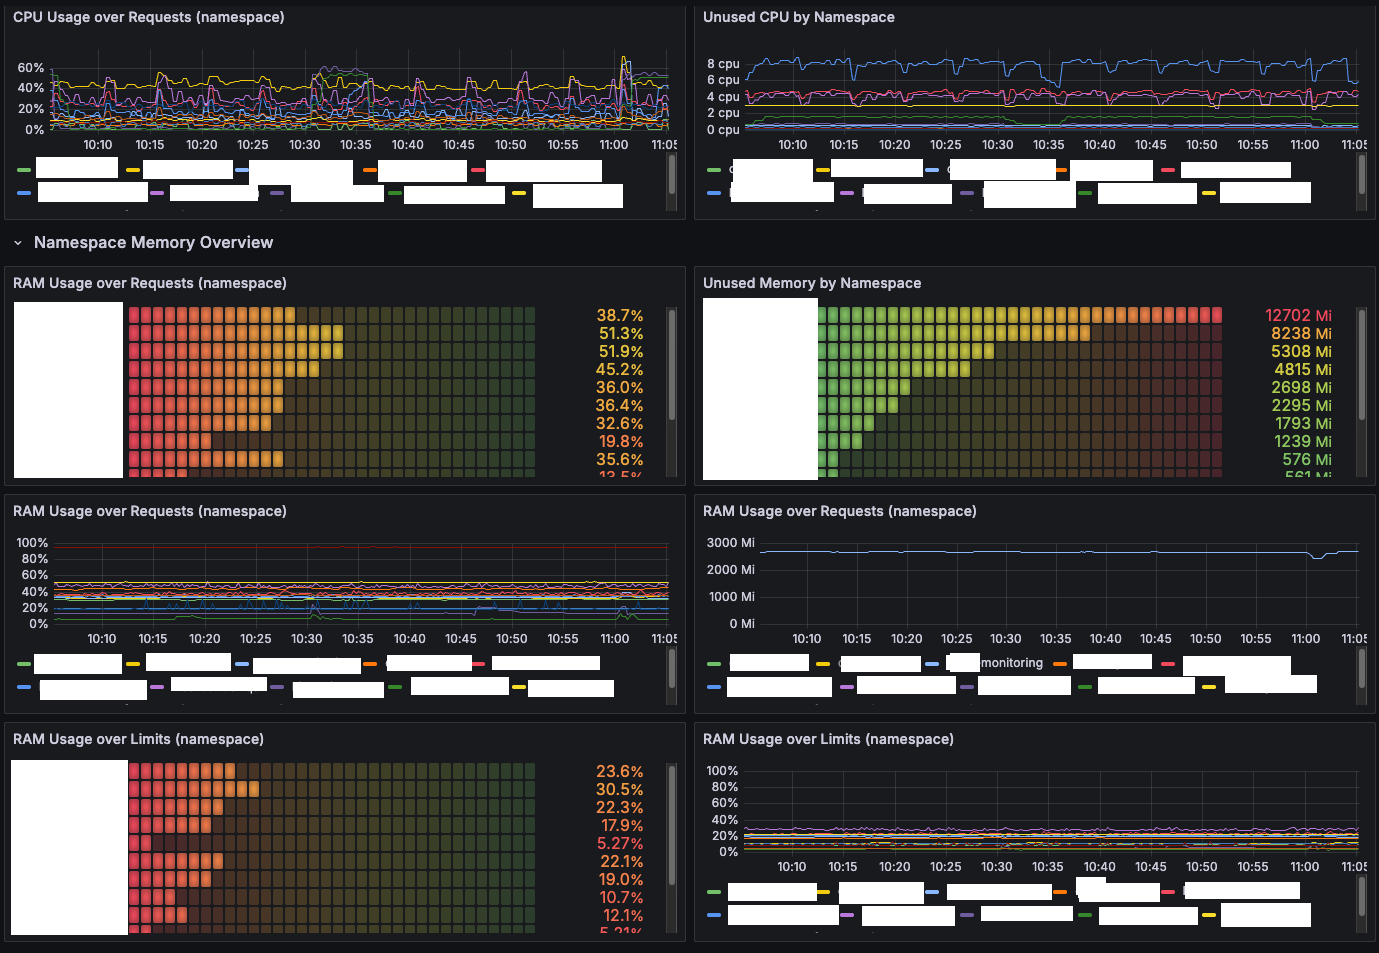
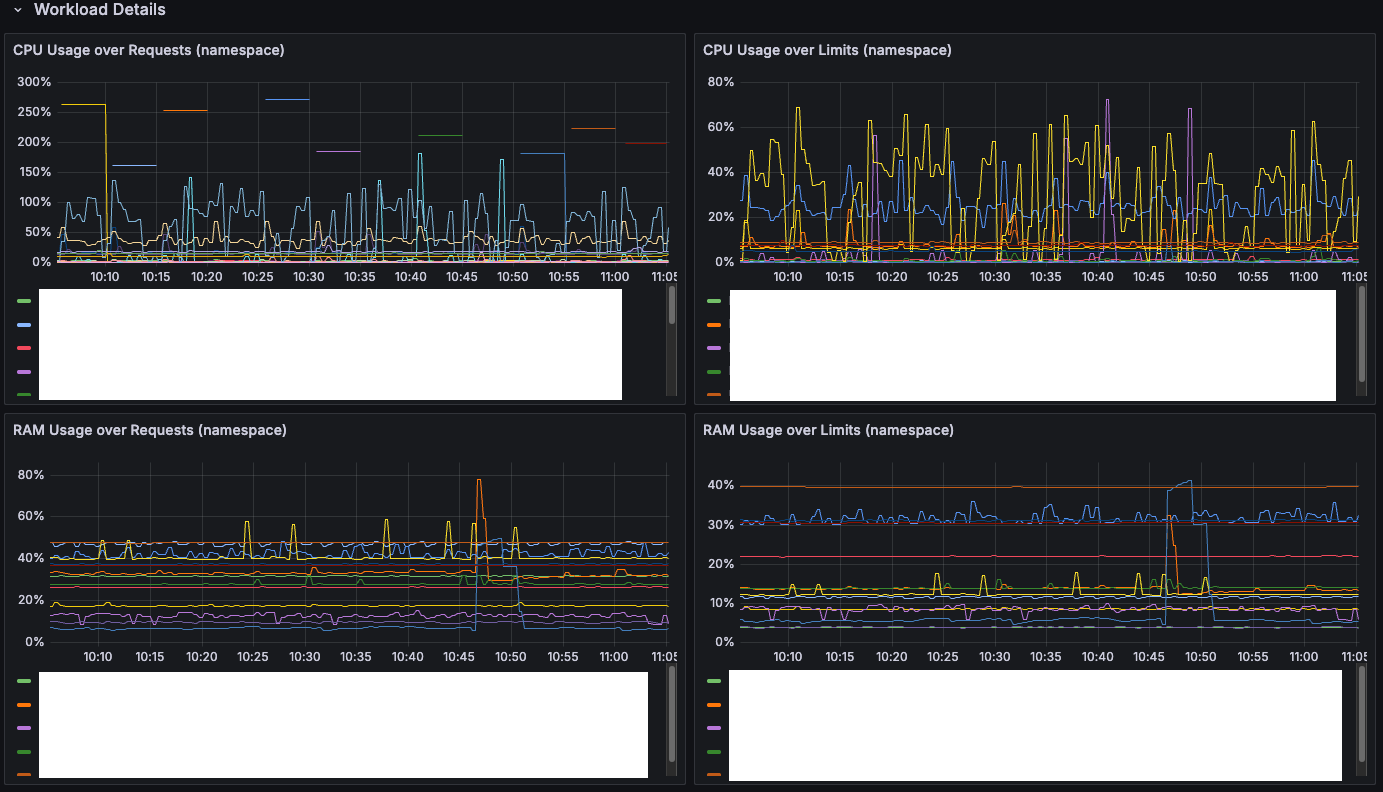
Visual feedback: the Grafana Rightsizing dashboard
All the numbers are useless unless the engineer and the FinOps team can see them. I open-sourced the board that powers our reviews here.
Highlights:
- Bar gauges that shout “Unused CPU by namespace” or “RAM usage over requests”.
- One-click drill-down from cluster → node pool → namespace → workload. (I still fondly remember building fancy PowerBI dashboards & drill-downs during my MSc in Data Engineering...)
- Side-by-side timeseries of requests vs limits (great for spotting throttling).
- Templating variables (
$namespace,$datasource) so it works across clusters without edits.
The JSON export is ~1,300 lines, so I won’t paste it here, but grab it from the repo and import—it works with vanilla Prometheus or Thanos.
GitOps: letting ArgoCD be the bad cop
Every workload lives in a common.yaml manifest with an individual client.yaml that team members copy-paste when they bootstrap a service. Nice, but after a year of “copy-paste & forget” you end up with requests.cpu: 1 for a pod that "sleeps" 99 % of the time.
Our path to redemption looks like this:
- Metrics first: As I already explained, run KRR with the python wrapper over all clusters, for a single whitebox application. Start with dev clusters first.
- Visual triage: Then, visually triage with Grafana each cluster (Yes, this is now really time-consuming) especially looking for peaks (And yes, you should zoom in, because zooming out just gives you the same perspective as in KRR)
- Manual patch: I open a pull request that edits the existing Chart
values.yaml—usually just two lines underresources.requestsandresources.limits. Sometimes, it's our custom-made Helm chart, and it's not even supported, so more than once I stopped here to add the functionality. - Code review: Another human eyeballs the diff, checks Grafana if needed, and approves. We deliberately keep this gate because context matters (peak sales day, batch job, cron-spike, etc.).
- ArgoCD applies: Once the PR merges, ArgoCD syncs the repo and rolls out the new settings.
- Feedback loop: Grafana updates in real time. If latency rises or an OOM-kill shows up, the Alert Manager will scream and the team can bump the value back up.
Why I killed CPU limits (and slept better)
I keep memory limits (to avoid the kernel panicking) but I dropped CPU limits on almost every workload. Here is the reasoning:
- CPU is a compressible resource. When a container hits its quota the kernel just throttles; nobody gets OOM-killed.
- Setting a limit lower than what your app can opportunistically use wastes idle cycles on the node.
- If every workload is sized by request but has no ceiling, the CFS scheduler still honours fairness via weights, so noisy neighbours can’t starve well-behaved pods.
- Removing limits improves tail latency for bursty services and raises overall utilisation—a win-win.
Edge cases where I might keep limits (and perhaps protect the node from scheduling mishaps for a really reduced number of cases): Non-critical apps that should be very far from the limit. In those cases I might bump the limit instead of removing it.
But from my experience, I never had to apply limits to those small applications, because that situation never actually happened. So I'm still betting on killing it everywhere 💣.
Overcommit, undercommit and QoS in practice
A few rules I learnt the hard way:
- Requests ≤ Node capacity → safe zone.
- Requests > Node capacity → the scheduler will over-commit, which is fine for CPU but could be starting to be suicidal for memory. Surpassing 150% could be a big problem, but it wildly depends on your context.
- Pair no-CPU-limit with a PriorityClass strategy. If the node is fully utilised, low-priority pods get throttled first, or even re-scheduled to other nodes.
- Guaranteed QoS (equal request-limit pairs) might be an overkill unless you run multi-tenant clusters with strict SLOs. I aim for “Burstable” QoS almost everywhere, but also keeping an eye on critical systems where Guaranteed makes sense.
Capacity planning, finally backed by data
All those YAML patches are nice, but the bigger gain is that I now have measured headroom:
- Cluster-level idle CPU / RAM → postpone node upgrades with confidence.
- Namespace-level → show teams the exact budget they consume.
- Month-over-month baseline → feed Finance a trend line they can convert into dollars.
If your org has the luxury of performance engineering talent (think Netflix), go further: instrument the app, profile hotspots (thanks Brendan Gregg for giving us such cool tools), fix them in code and then re-run KRR. Rightsizing without profiling is good; doing both is how you bend the cost curve and get a myriad of other benefits.
Results & next steps
- Around ~500 vCPUs and ~200 GiB RAM returned to the node pools
- Average node utilisation jumped from ~10 % to ~40 % over the clusters
- Zero customer incidents from my side
Next on the roadmap:
- Pipeline the output from the KRR into GitOps (with a manual check step)
- Feed the KRR output into a VPA recommender for real-time adjustments.
- Integrate with GKE’s built-in recommendations to cross-validate numbers (see Google’s “Right-sizing at Scale” guide).
- Enrich the Grafana board with cost so engineers can translate MiB -> $ instantly.
- Upgrade to Kubernetes 1.33 and enjoy pain-free adjustments of requests and limits.
Takeaways
- Good defaults decay; audit them continuously.
- Automate the boring part (metrics → KRR → GitOps).
- Check & visualise the outcome or it never happened.
- Drop CPU limits unless you have a very good reason.
- Rightsizing is not a one-off project—it’s the heartbeat of capacity planning.
Give the python KRR script a spin, import the dashboard, and let me know on Mastodon how many cores/memory you reclaimed!