Understanding High Load Averages in Kubernetes: It's Not Always CPU

The other day a colleague noticed something odd in a Grafana dashboard for one Kubernetes node in AWS: A sawtooth pattern! Observability is a full topic on its own... but not useful if you don't act on it. 😎 Cool, let's dive in and investigate.
Investigation
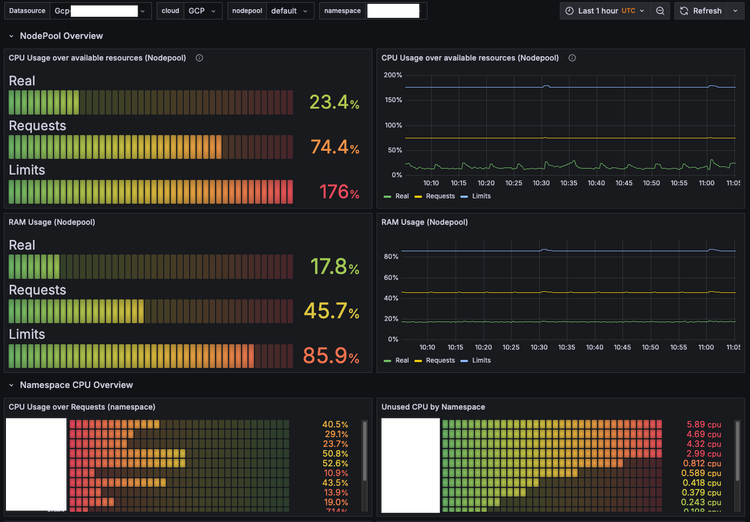
The dashboard I'm looking at is just the default one pulling data from Node Exporter. Pretty quickly, though, I realized this wasn't happening only on one node, but actually on two nodes within the same node pool. So I checked which pods these nodes were running:
kubectl get pods -A --field-selector spec.nodeName=$nodenameAt first glance, it wasn't clear which pod might be causing the issue 👀. After briefly looking at what was running across all nodes, I tried checking CPU utilization with another command (and even double-checked with another Grafana dashboard 📊):
kubectl get pods -A --field-selector spec.nodeName=ip-10-160-59-140.ec2.internal -o custom-columns=NS:.metadata.namespace,POD:.metadata.name --no-headers | while read ns pod; do
  kubectl top pod -n $ns $pod
done
Surprisingly, the CPU usage is negligible in the node:
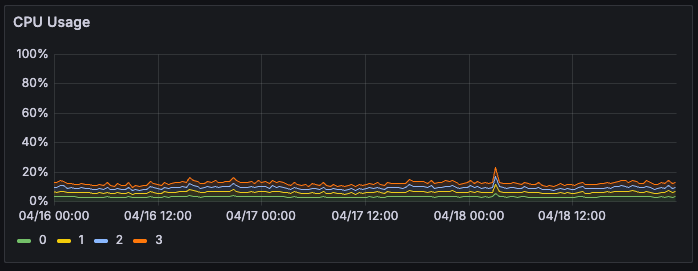
t first, this left me pretty confused 😕—CPU usage showed no sign of spikes or exhaustion. So I needed to better understand what the "Load Average" metric really meant in this context.
Negligible CPU Utilization 📉
To dig deeper, I checked out the PromQL queries behind the Load Average graphs:
node_load1{job="node-exporter", instance="$node"}The other queries were similar (using node_load5and node_load15) but smoothed over longer intervals. Still unsure what's going on, I looked into what exactly node_load1 measures. The Node Exporter GitHub repo doesn't explain this clearly, but a quick Kagi search 🔍 led me to a helpful page explaining that:
node_load1: 1-minute average load and is read from the hosts /proc/loadavg file
Interesting! Next stop, official RedHat docs:
This file provides a look at the load average in regard to both the CPU and IO over time
Fair enough 📚. Let's keep digging. From the official Linux man7 doc page for proc_loadavg:
The first three fields in this file are load average figures giving the number of jobs in the run queue (state R) or waiting for disk I/O (state D) averaged over 1, 5, and 15 minutes.
Aha 🤓! So it is safe to assume, given that there is almost no CPU utilization, that we have tasks piling up in disk I/O wait (state D)—that's causing our high load average.
Disk I/O problems? 💾
Fine, but why? Could there be some issue in the communication between pods and mounted Persistent Volumes (PVs)? Let's take a look at what StorageClasses (SCs) our Kubernetes cluster has available:
kubectl get storageclassWe have several listed, but which ones are specifically being used by the affected nodes? Let's figure that out with this (admittedly ugly) command:
echo "NAMESPACE,POD,PVC,PV,SIZE,STORAGECLASS"
kubectl get pods -A --field-selector spec.nodeName=$node \
-o custom-columns="NAMESPACE:.metadata.namespace,POD:.metadata.name" --no-headers | \
while read ns pod; do
  for pvc in $(kubectl get pod "$pod" -n "$ns" -o jsonpath="{.spec.volumes[*].persistentVolumeClaim.claimName}" 2>/dev/null); do
    pv=$(kubectl get pvc "$pvc" -n "$ns" -o jsonpath='{.spec.volumeName}' 2>/dev/null)
    size=$(kubectl get pv "$pv" -o jsonpath='{.spec.capacity.storage}' 2>/dev/null)
    sc=$(kubectl get pv "$pv" -o jsonpath='{.spec.storageClassName}' 2>/dev/null)
    [[ -n "$pv" && -n "$pvc" ]] && echo "$ns,$pod,$pvc,$pv,$size,$sc"
  done
done
🤔 Output from this showed that there were two SCs in use for both problematic nodes: efs and ebs-encrypted. Since the PVs for similar apps on other nodes (using EBS only) didn't seem similarly affected, my primary suspect became EFS.
Checking the AWS Docs for EFS performance (particularly NFS), my initial suspicion fell on 'Burst Throughput', but after closer inspection, it's configured to 'Elastic Throughput'. So it wasn't a burst issue after all.
Next step, I connected via SSH to the affected nodes and ran:
dmesg | grep -i nfs
dmesg | grep -i efs
After execution, the result is clear 🔑:
nfs: server 127.0.0.1 not responding, timed out – x999 timesNFS (EFS) 🎯
Weirdly enough, the NFS service continued working (or appeared to), but it was obviously failing intermittently 🚨. After a quick look, I noticed our DaemonSet (efs-csi-node) was restarting periodically approximately every 10 hours (need to work on those alerts!). Its restarts lined up perfectly with the spikes on the CPU Saturation graph I'd previously seen.
First, I tried increasing the memory limits on the DaemonSet, but unfortunately that didn't fix the issue—it kept restarting periodically.
After some more digging around GitHub 🚩, I stumbled upon a very similar issue
Finally, I decided to rotate the affected nodes and upgraded the EFS driver to the latest version. After making these changes, the error seemed to vanish—for now, at least 😐.
Interestingly, the client hadn't complained or reported any issues at all. I suspect it might have something to do with a flawed deployment or update they'd performed at some point in the past, potentially leaving behind orphaned processes. Right now, though, everything seems stable ☝️.
If it ever pops up again in the future, I'll go deeper into the application to see exactly what's going on regarding EFS usage. For now, historical data from CloudWatch looks totally normal, leaving me scratching my head a little bit 😅.